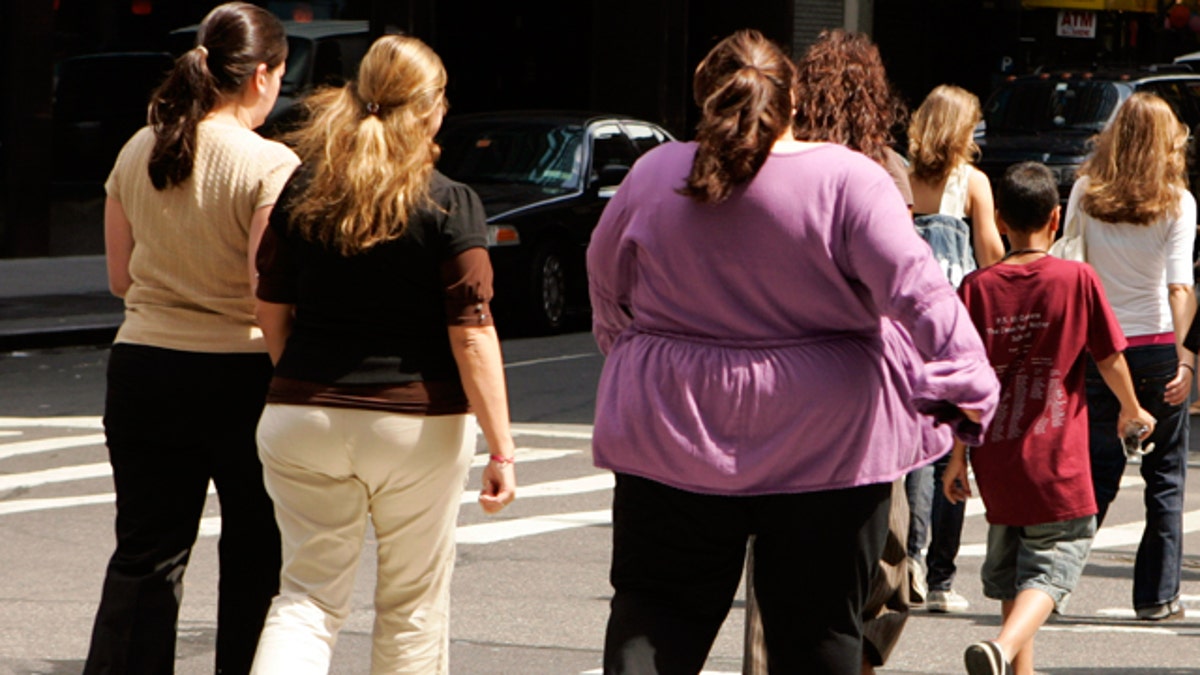
The obesity epidemic is showing no signs of retreat in the United States.
As of this week, the nation's obesity rate for 2014 stands at 27.7 percent, according to new Gallup data. That's up from the 2013 rate of 27.1 percent, which was the highest annual rate ever measured by the polling organization.
When Gallup started tracking obesity in 2008, the average annual rate among Americans was 25.5 percent. So far this year, only 35 percent are considered "normal weight." [7 Little-Known Tricks That Shave Pounds]
Obesity — which was recently recognized as a disease by the American Medical Association — disproportionately affects certain demographic groups. According to Gallup's latest results, black adults still have the highest obesity rate of any group (35.5 percent), while young adults between ages 18 and 29 have the lowest (17.0 percent).
The new data also revealed economic and geographic disparities. Among Americans who make more than $90,000 each year, 23.1 percent are obese. In contrast, 31.5 percent of people with an annual income of $36,000 or less are considered obese.
The obesity rate was highest in the South (29.2 percent), followed by the Midwest (28.6 percent), while in the eastern United States, 25.6 of adults are obese, and in the West, 24.1 percent are obese.
Gallup officials will release a state-by-state breakdown of average obesity rates at the end of the year. Last year, the skinniest state was Colorado, where only 18.7 percent of adults were obese. The fattest state was West Virginia, where 33.5 percent of people were obese.
"While it is difficult to identify long-term trends from short-term data, these data suggest, at best, no retreat in the obesity epidemic and, at worst, a deterioration," Janna Lacatell, director of Healthways Lifestyle Solutions, said in a statement. "Given that obesity leads to higher rates of serious health conditions like diabetes and hypertension, and has been shown to cause disease onset at younger ages, this is a significant public health concern. Further, populations that have a disproportionately high obesity rate, such as African Americans and southerners, also have disproportionately higher diabetes rates."
The survey results come from interviews conducted between Jan. 1 and May 19, 2014, with a random sample of 64,546 adults in all 50 U.S. states and the District of Columbia as part of the Gallup-Healthways Well-Being Index.
Gallup officials said they determined obesity using the survey participants' self-reports of their height and weight to calculate their body mass index (BMI) score, a metric used to gauge how much fat is on a person's body. [BMI Calculator: Determine Your Body Mass Index]
Individuals with BMI values of 30 or above are considered "obese." A BMI of 25 to 29.9 lands someone in the "overweight" category. People with a BMI of 18.5 to 24.9 are classified as "normal weight," while those with a score of 18.4 or less are considered "underweight."
Related:
Dieters, Beware: 9 Myths That Can Make You Fat
5 Things Your Poop Says About Your Health
Countdown: 7 Medical Myths Even Doctors Believe
Copyright 2014 LiveScience, a TechMediaNetwork company. All rights reserved. This material may not be published, broadcast, rewritten or redistributed.


