


A look at the actual numbers of hate crimes in the US
59 percent of religious hate crimes are against Jews
National hate-crime statistics are skewed because there is a wide disparity of criteria that state and local authorities use in identifying such offenses, according to a report issued Wednesday.
The analysis, “Five Facts: Hate Crimes, 2010-2015,” by Seattle-based data intelligence firm LiveStories found that nearly 40,000 hate crimes have been reported across the country since the start of the decade but that the geographic dispersion of those reported crimes varies widely. Most of them were in Northern states such as Michigan, Washington, and New York, while the region with the fewest incidents were in the Deep South.
LiveStories CEO Adnan Mahmud said that the likely reason for lower reported incidents in the South may be due to differing ways law enforcement agencies define or classify hate crimes.
“You could assume that the high level of hate crimes should be equal across the country,” he said to Fox News. “But there’s a massive difference. The question becomes ‘what causes the difference?’”
Mahmud says that the criteria for deciding whether an offense qualifies as a hate crime varies from agency-to-agency.
“It could be as simple as data entry,” he said. “The methods could differ from state to state. Law enforcement in northern states may have a broader definition of what classifies as a hate crime.”
The report also found that, while the overall number of hate crimes has stayed roughly the same in the six decades the analysis covered, reported anti-Islamic incidents spiked 67 percent between 2014 and 2015.
Most reported hate crimes reflect racial and ethnic hostilities, with African-Americans being the racial group most frequently targeted in these types of offenses, the LiveStories study concluded. The two other groups most frequently the object of reported hate crimes are members of the LGBT and Jewish communities.
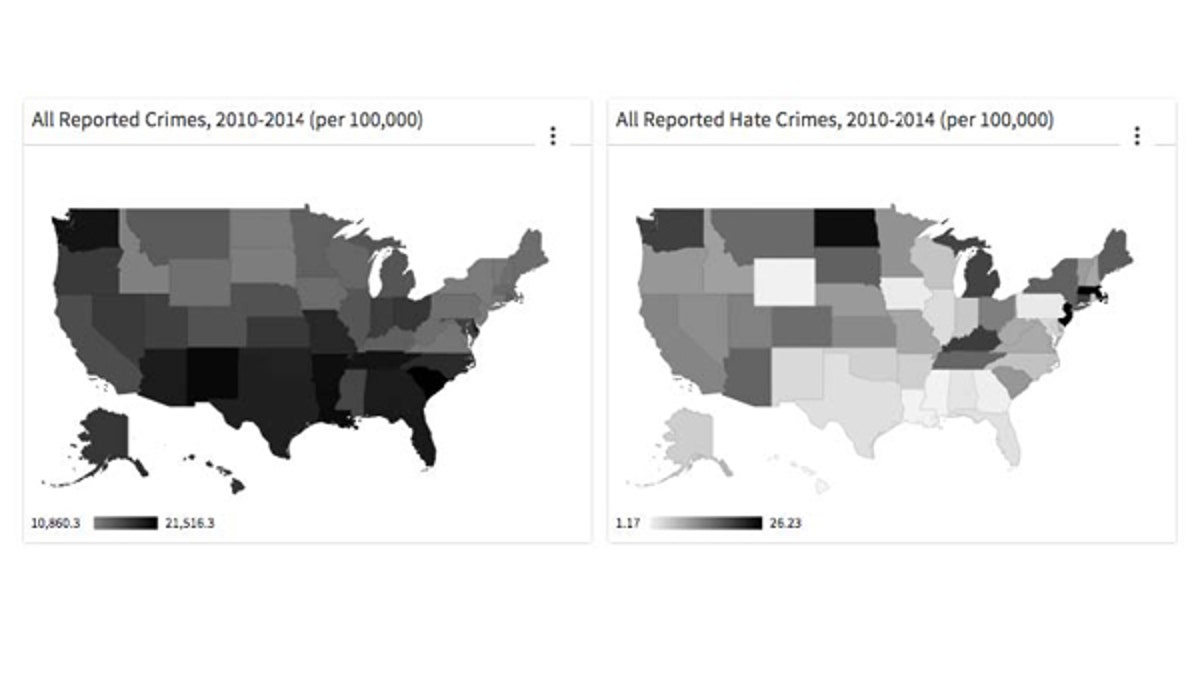
LiveStories compared rates of hate crimes to overall crime rates across the country from 2010 to 2014 and found that while there may not be as many reports of hate crimes across the south, the rate of all crime is much higher in the region when compared with the rest of the country. (LiveStories)
The LiveStories analysis also compared rates of hate crimes to overall crime rates, finding that while there may not be as many reports of hate crimes in the South, the rate of all types of crime is much higher in that region when compared with the rest of the country.
“The difference between the highest and lowest rates is also significantly greater for hate crimes than for non-hate crimes,” the report says. “Between 2010 and 2014, the total crime rate varies among states by a factor of two.”
The report used statistics and hate crime data from the Federal Bureau of Investigation’s Uniform Crime Reports (UCR), which gathers data from local law enforcement agencies throughout the country.