


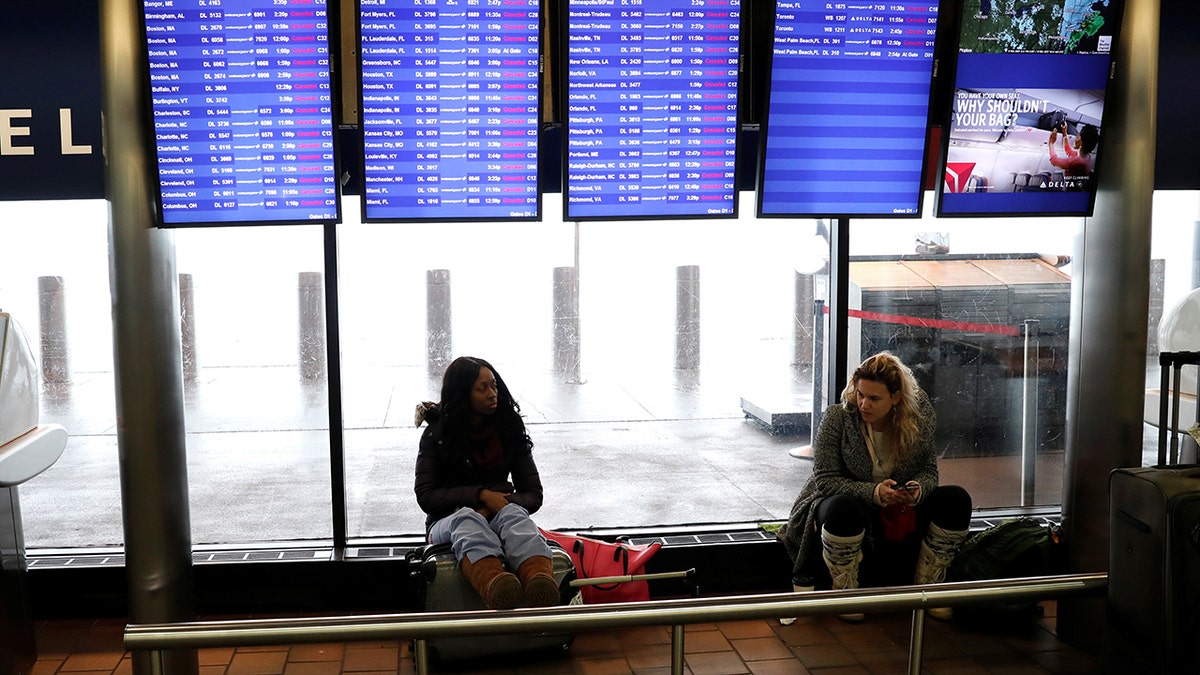
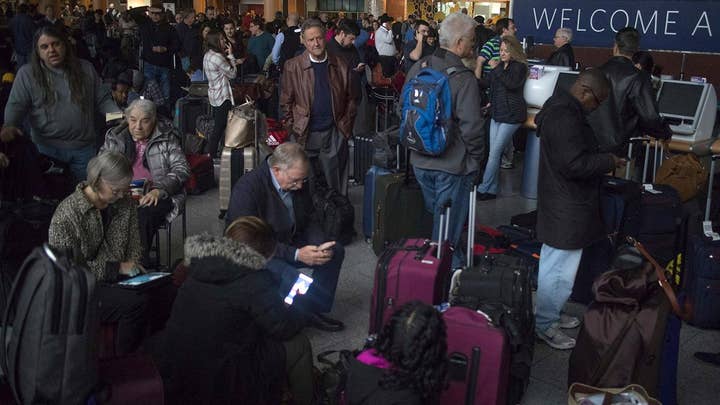
Winter storms have grounded flights at New York's LaGuardia Airport more than once since the beginning of 2018. (Reuters)
When it comes to flight cancellations, how does your airport stack up?
A new study by InsureMyTrip.com broke down which airports in the United States had the highest percentage of canceled trips.
New York City’s LaGuardia Airport had the highest percentage of flight cancellations at 3.23 percent. Houston’s George Bush Intercontinental came in second with 2.73 percent, and Florida’s Fort Lauderdale-Hollywood International rounded out the bottom three with 2.7 percent.
More From TravelPulse
In terms of total cancellations last year, the U.S. Department of Transportation revealed Hartsfield-Jackson Atlanta International Airport canceled the most flights with 5,419. A power outage in December caused 1,489 of those cancellations.
Another airport that struggled with canceled flights was Chicago’s O’Hare International, which racked up 3,719 cancellations last year. George Bush Intercontinental was also in the bottom three with 3,529 canceled flights.
But while Atlanta’s Hartsfield-Jackson airport had the most registered flight cancellations, those canceled trips only accounted for 1.49 percent of the its 364,655 total flights.
READ MORE: Here Are The World's Most Punctual Airlines
Overall, the Department of Transportation revealed that only 1.5 percent of flights in the U.S. last year were canceled, which was still an increase from the 1.2 percent of flights canceled in 2016.
The Department of Transportation also found travelers are much more likely to deal with flight delays, with airports registering a nationwide average of 18.14 percent in 2017.
InsureMyTrip.com broke down the 25 airports with the highest percentage of flights canceled in 2017:
| Rank | Airport | Total Flights | Canceled Flights | Cancellation % |
| 1 | New York, NY: LaGuardia | 93,326 | 3018 | 3.23 |
| 2 | Houston, TX: George Bush Intercontinental/Houston | 129,271 | 3529 | 2.73 |
| 3 | Fort Lauderdale, FL: Fort Lauderdale-Hollywood International | 90,078 | 2429 | 2.7 |
| 4 | Newark, NJ: Newark Liberty International | 115,968 | 2982 | 2.57 |
| 5 | New York, NY: John F. Kennedy International | 94,454 | 2076 | 2.2 |
| 6 | Boston, MA: Logan International | 125,456 | 2665 | 2.12 |
| 7 | Washington, DC: Ronald Reagan Washington National | 74,408 | 1488 | 2 |
| 8 | Orlando, FL: Orlando International | 131,998 | 2606 | 1.97 |
| 9 | San Francisco, CA: San Francisco International | 174,631 | 3299 | 1.89 |
| 10 | Baltimore, MD: Baltimore/Washington International Thurgood Marshall | 101,015 | 1730 | 1.71 |
| 11 | Philadelphia, PA: Philadelphia International | 73,194 | 1197 | 1.64 |
| 12 | Atlanta, GA: Hartsfield-Jackson Atlanta International | 364,655 | 5419 | 1.49 |
| 13 | Chicago, IL: Chicago Midway International | 87,203 | 1238 | 1.42 |
| 14 | Chicago, IL: Chicago O'Hare International | 266,460 | 3719 | 1.4 |
| 15 | San Diego, CA: San Diego International | 84,056 | 997 | 1.19 |
| 16 | Charlotte, NC: Charlotte Douglas International | 113,095 | 1270 | 1.12 |
| 17 | Dallas/Fort Worth, TX: Dallas/Fort Worth International | 181,208 | 1868 | 1.03 |
| 18 | Los Angeles, CA: Los Angeles International | 214,297 | 2107 | 0.98 |
| 19 | Detroit, MI: Detroit Metro Wayne County | 126,609 | 1196 | 0.94 |
| 20 | Las Vegas, NV: McCarran International | 151,720 | 1367 | 0.9 |
| 21 | Denver, CO: Denver International | 223,165 | 1592 | 0.71 |
| 22 | Seattle, WA: Seattle/Tacoma International | 137,176 | 833 | 0.61 |
| 23 | Minneapolis, MN: Minneapolis-St Paul International | 134,591 | 767 | 0.57 |
| 24 | Phoenix, AZ: Phoenix Sky Harbor International | 154,508 | 870 | 0.56 |
| 25 | Salt Lake City, UT: Salt Lake City International | 111,912 | 448 | 0.4 |