


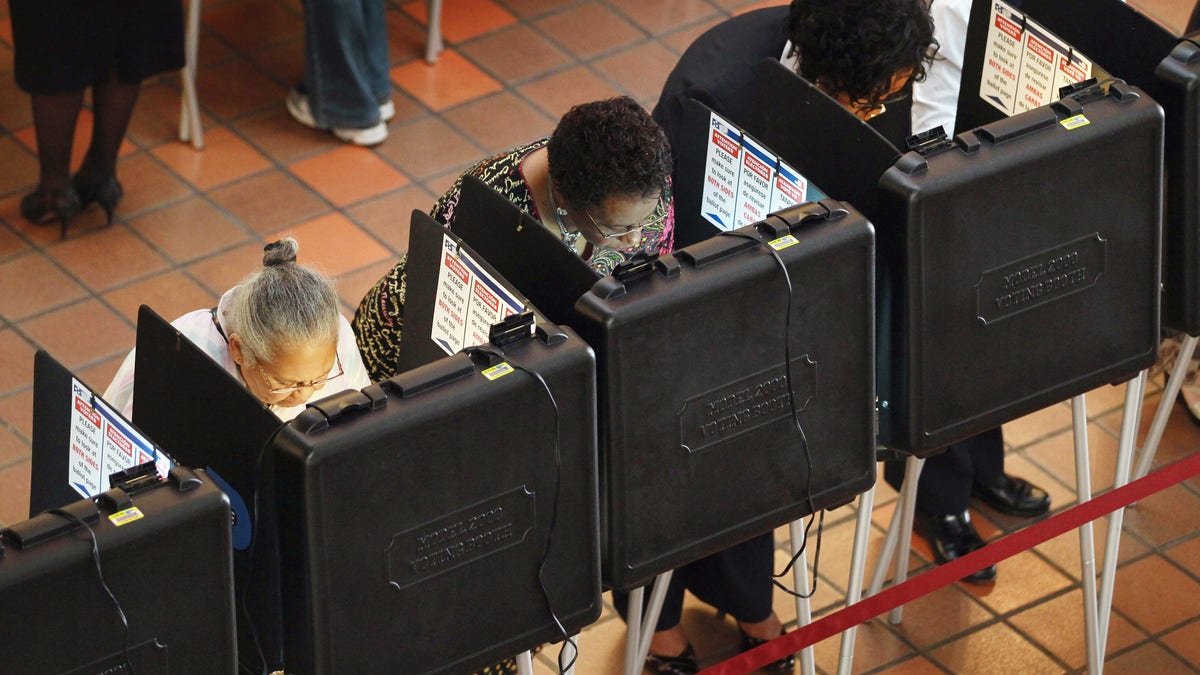
MIAMI - OCTOBER 18: People cast their votes at a polling station set up at the Miami-Dade Government Center on October 18, 2010 in Miami, Florida. Florida residents headed to the polls to cast votes on the first day of early voting in teh midterm elections. (Photo by Joe Raedle/Getty Images) (2010 Getty Images)
As candidates continue a fierce race to win the nomination, analysts and campaign staffers spend sleepless nights crunching numbers that hopefully reveal an edge for their candidate of choice. From Fox News polls, NBC polls, ABC polls, ARG polls, and many other XYZ polls, it seems both media and campaigns selectively report on the data that tells a better story for their camp.
In a new world of digital democratization and information, isn’t there a better way to draw political intelligence that could mine the unbiased and unfiltered digital opinions of the people? The answer is a big YES.
While over 90 percent of the population in New Hampshire is Non-Hispanic White, the demographic breakdown will play an important role when the campaigns get to highly diverse battle-ground states like Florida, Colorado, Nevada, among others.
While powerhouses like Google, Twitter and Facebook have already put their digital engines at the center of various debates, there is still a greater opportunity to use “big-data” to draw insights that could make a strategic difference for those in the race. After all, how can you draw meaningful conclusions with sample sizes that range from 100 to 900 from telephone interviews? How could these polls accurately capture the sentiment of Millennials – who I doubt are at home with a landline being interviewed – and be representative of the 30 percent plus of minorities who make up America’s voting population? Bottom line, there must be a better way.
My company and I work as business strategists guiding some of America’s largest Fortune 500 companies in their quest to become more relevant and successfully reach today’s diverse consumers. Like politicians, corporations also are looking for ways to be relevant, win in key states and stay ahead of America’s shifting demographics. So, why couldn’t we use the same tools used for market cultural intelligence™ to draw political intelligence?
Using a proprietary methodology typically used for brands and corporations seeking marketing insights, we have run a preliminary CulturIntel™ report. This data shows share of voice and sentiment for each GOP candidate; including a breakdown by ethnic segment. Instead of hundreds of data points, it reports on thousands of unbiased inputs among adults 18+. This never-seen-before information reveals differences and affinity of candidates at the national and local levels across ethnic groups.
The data was extracted from unstructured big-data that comes from discussions about each candidate across various digital and social media channels (Facebook, Twitter, message boards, forums, content sharing, etc.), anywhere there was an “opted in” digital dialogue. Data was analyzed using an arsenal of tools such as key word Boolean, topical text analytics, artificial intelligence, machine learning and human oversight to understand sentiment, topics and opinions. Cultural segments are identified through profile scanning and language identifiers.
This is what the big data analysis reveals about the New Hampshire GOP Race based on analysis conducted 24 hours after the debate among adults 18+ in New Hampshire and nationally, regardless of political affiliation.
1. Cruz is in the lead reporting the highest percentage of positive sentiment at 43 percent, followed by Rubio at 35 percent and Trump at 32 percent among Non-Hispanic Whites in New Hampshire. This based on a total Non-Hispanic White sample size of 3,093 adults 18+ in New Hampshire and analysis conducted 24 hours after the 2/6/16 GOP debate.
2. Christie reports the highest percentage of negative sentiment at 49 percent, followed by Rubio at 45 percent among adults 18+ in New Hampshire. This may be indicative of some of the avid attacks witnessed by voters during the debate.
3. Trump leads in Share of Voice (SOV) at 34 percent, followed by Cruz at 27 percent and Rubio at 18 percent. While this may not represent a direct correlation to positive intent to support and vote, it validates that Trump continues to garnish the buzz and PR even by voters digitally. SOV represents the relative portion of digital/ online discussions available to a single candidate over a specified time period (24 hours post debate) in New Hampshire.
4. Contrary to the polls, analysis of national conversations among adults 18+ report a surprising Bush in the lead across all ethnic groups capturing the highest scores in positive sentiment at 44 percent among Non-Hispanic whites, 44 percent among Hispanics and 45 percent among African Americans. This may be indicative of his positive cross-cultural and more moderate appeal and a good performance during the NH debate.
5. Based on positive sentiment across all adults 18+, Cruz leads nationally with 44 percent, followed by Trump at 42. Bush rises to the #3 spot followed by Rubio.
While over 90 percent of the population in New Hampshire is Non-Hispanic White, the demographic breakdown will play an important role when the campaigns get to highly diverse battle-ground states like Florida, Colorado, Nevada, among others. In those states, developing relevant grass roots initiatives, in-language campaigns, messaging that address key issues and gaining support from minorities will be a critical winning factor.
For the skeptics, this methodology has already been used by major corporations in guiding their strategies and also validated by the Harvard Medical School, saying it “presents powerful, real world data using [a] new modality for qualitative research. Future research should further focus on how to employ and learn from this type of social intelligence research.” It was also recognized as a Top Innovation of 2015 by PM360.
Further analysis can be completed to identify the key drivers and topics correlating to positive, negative and neutral sentiment across segments as well as specific messaging opportunities by candidate by state.
More information can be found at www.culturintel.com and more reports can be downloaded at the CulturIntel™ blog at culturintel.tumblr.com/.