LIVE UPDATES
2026 Midterms: Primaries, Key Races and Election Results
Read below for 2026 primary elections results, today's races, upcoming and recent primary races, 2026 primary news and the 2026 primary elections schedule. Stay up-to-date on all things 2026 primary elections related with Fox News.
Upcoming Races
Check back soon for upcoming races
Recent Races
2026 Primary News
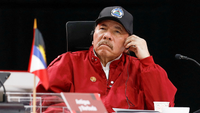
Nicaragua's Ortega says country will 'never again' hold elections, shutting out opposition

Darline Graham focuses on kitchen-table issues as she announces full-term Senate bid

Johnson's strategy to bypass Democrats' SAVE Act blockade survives key vote, handing GOP big win

Socialist insurgents force moderate Democrats into high-risk showdown over must-hold races

Retired Lt. Col. running for Congress backs Trump Iran strategy: 'He's ending a 47-year conflict'

Don Lemon claims Trump's MAGA movement is 'closest thing' to modern Nazi Party without Holocaust

Warren’s latest ‘kiss of death’ endorsement sparks mockery over disastrous political picks

Nancy Mace reveals Senate decision as Lindsey Graham's sister redraws the race

Birth tourism fight shifts to US ‘tropical maternity ward’ with history of Chinese exploitation
